介绍
本文主要是记录一些 Matplotlib 的使用方法以及注意事项。
Note: 如果没有特别说明,plt 代表 matplotlib.pyplot,np 代表 numpy
1 | import numpy as np |
本文代码主要在 Jupyter notebook 中执行,画图之前使用了一下 magic 方法
1 | %matplotlib notebook |
创建多个子图
一个常用的应用就是在一个 figure 里面画多个图,此时需要 add_subplot 方法或者 subplots 方法。
使用 add_subplot
1 | fig = plt.figure() |
使用 subplots
1 | fig, axes = plt.subplots(1, 2) |
保存图像到文件中
可以使用 plt.savefig 将图像保存到文件中,也可以使用 figure 对象的属性方法 savefig。
1 | data = np.arange(10) |
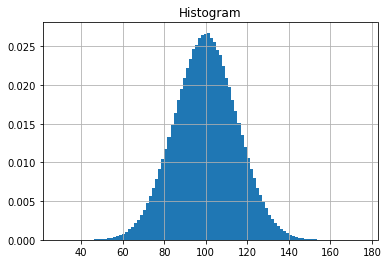
特定图像
Histogram
直方图 (Histogram) 使用的是 hist 函数进行绘制,bins 选项可以设置bin的个数。
1 | mu, sigma = 100, 15 |